← Back to blog
How to create and save custom PowerPoint chart templates
One question that always comes up is: "Can you create custom charts that we can reuse?" The answer is yes. In this guide, we will walk you through the step-by-step process of creating and saving custom PowerPoint chart templates.

Why create custom chart templates in PowerPoint?
Custom chart templates are essential for teams that want to:
- Save time: instead of recreating charts from scratch, templates provide a pre-designed framework you can reuse.
- Stay on-brand: templates ensure charts are consistent with your corporate colors, fonts and design guidelines.
- Improve productivity: teams can focus on data insights rather than formatting charts repeatedly.
Step 1: Design your custom PowerPoint chart
- Insert a chart like you normally do by going to Insert > Chart on the main ribbon.
- Choose the chart type (e.g. bar, line, pie) that best represents your data.
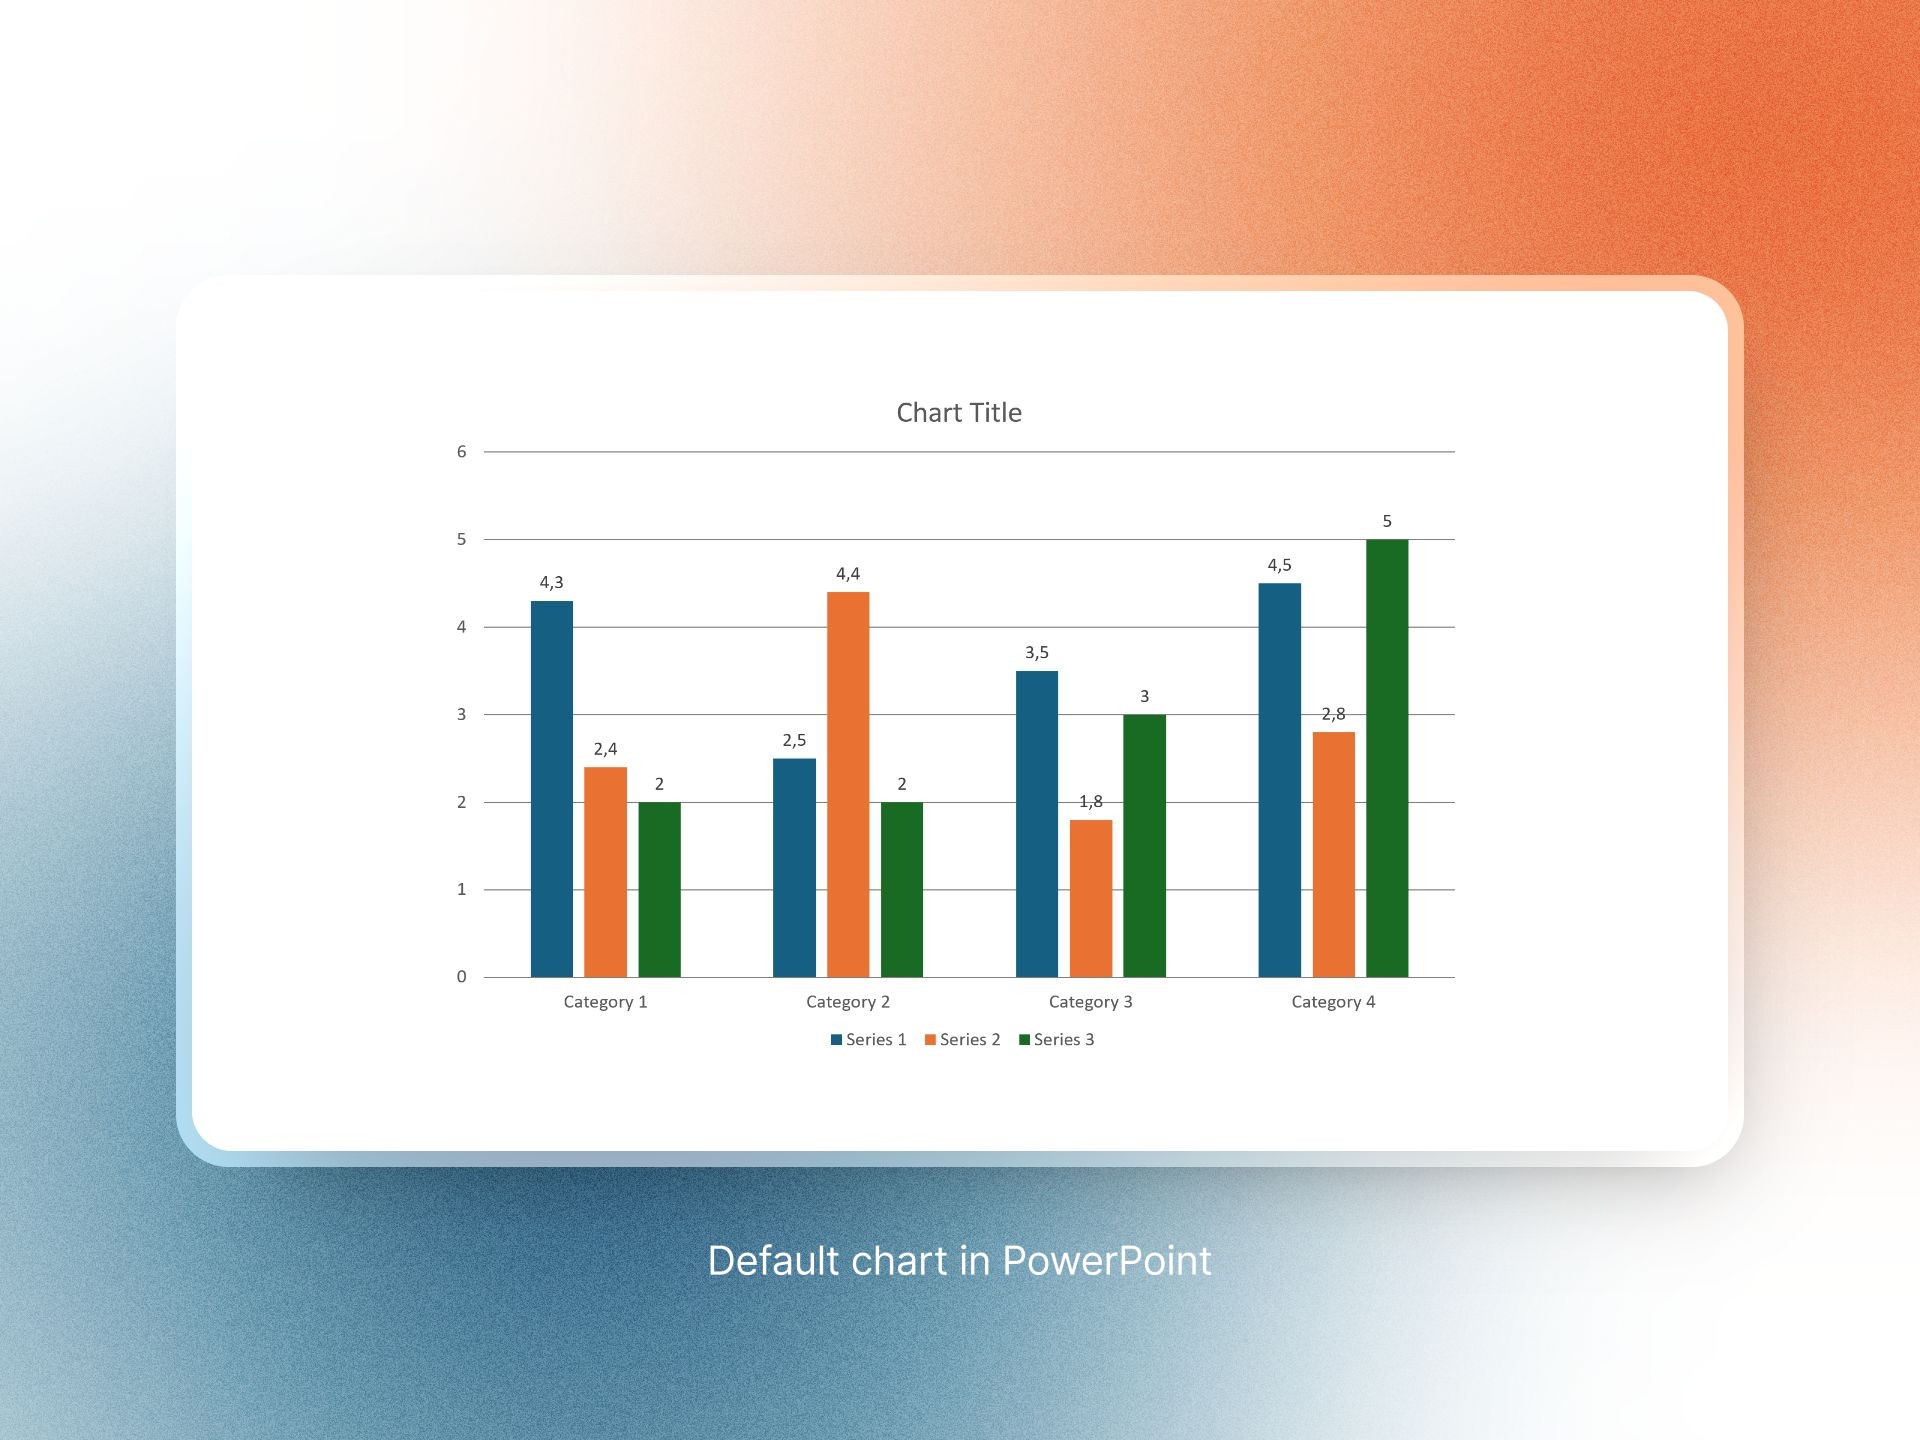
- For a bar chart, for example, you would see the default design below (it uses the default PowerPoint font and colors).
Step 2: Customize your chart design
- Use the Chart Design tab to format your chart.
- Adjust colors to match your brand palette.
- Change fonts to align with your corporate typography.
- Remove unnecessary elements for a cleaner look.
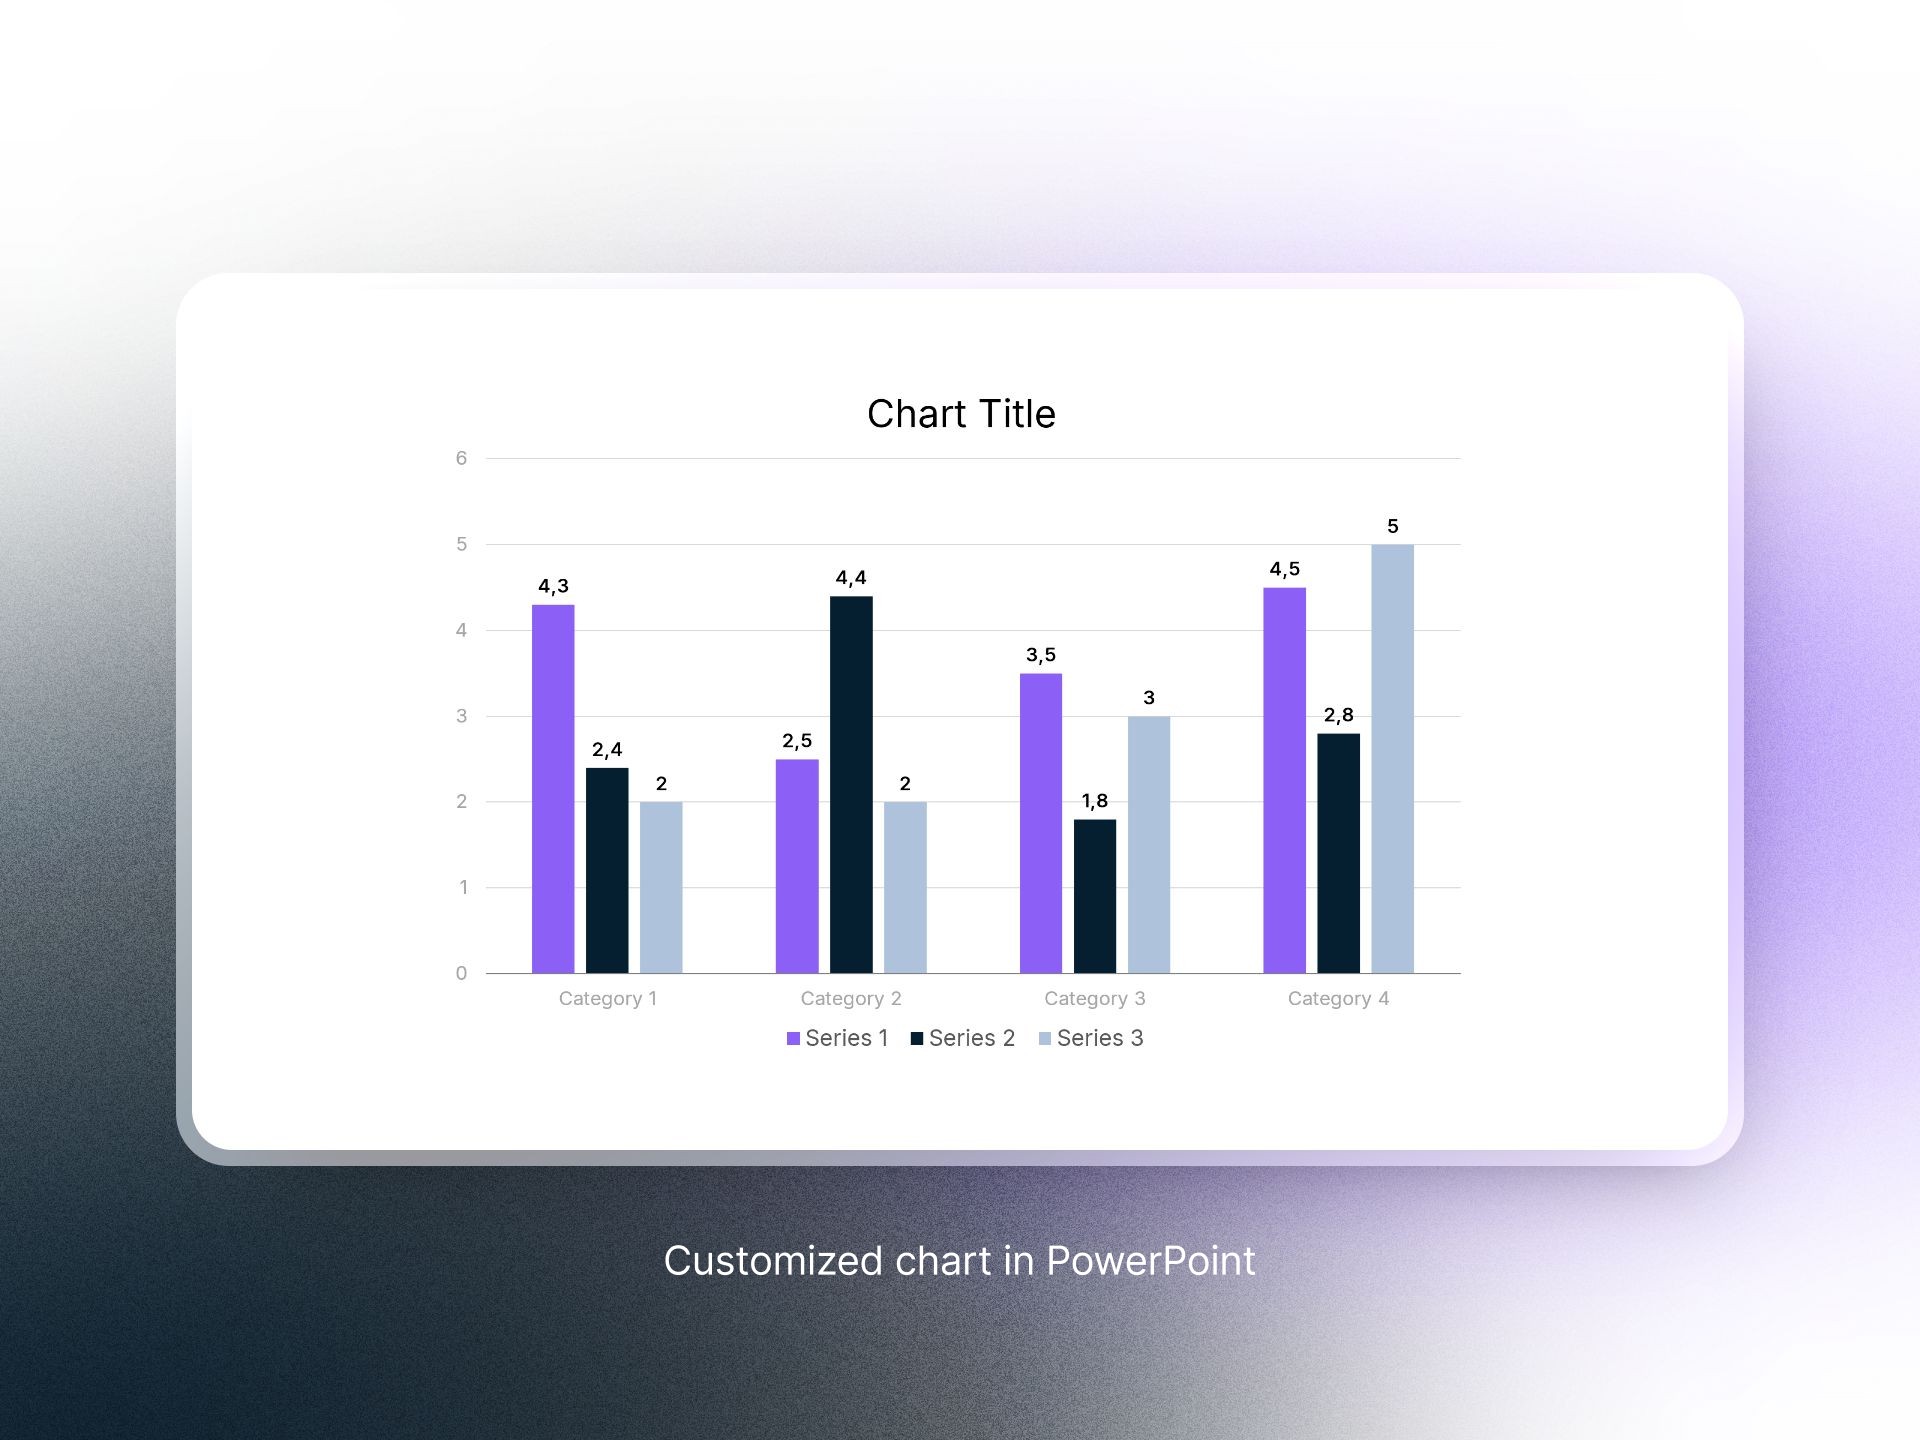
- Below you can see an example of a customized chart in PowerPoint.
Step 3: Save your custom chart as a template
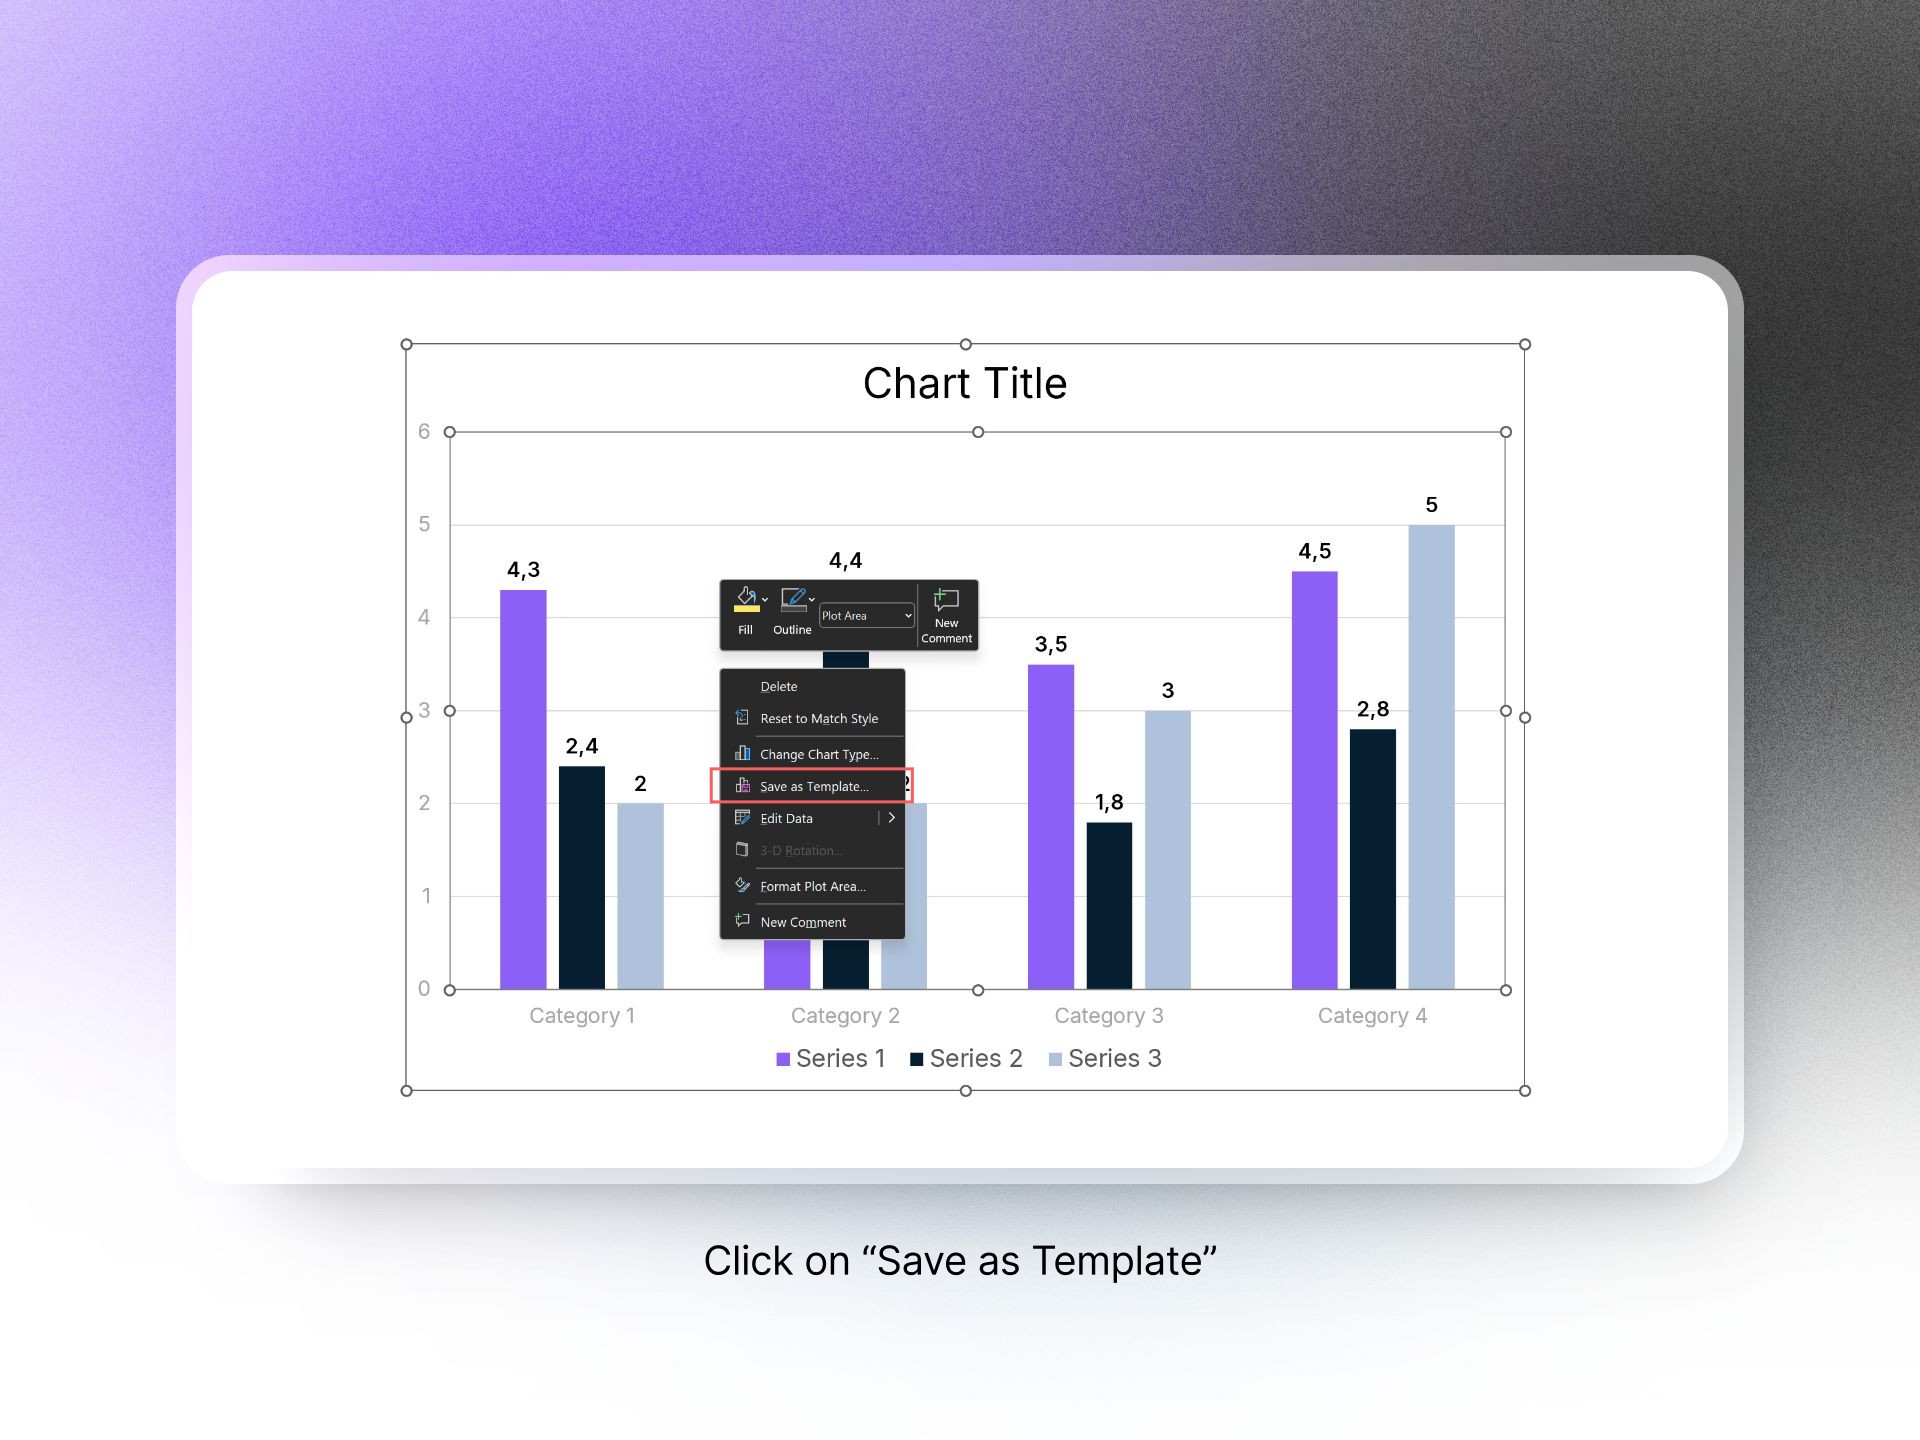
- Once you are happy with your chart design, right-click on the chart area.
- Select Save as Template (see the screenshot below).
- Give it a descriptive name (e.g. "BrandName_Bar_Chart") and save it in the default Chart Templates folder.
Step 4: Use your custom branded PowerPoint chart
- Open a new or existing presentation.
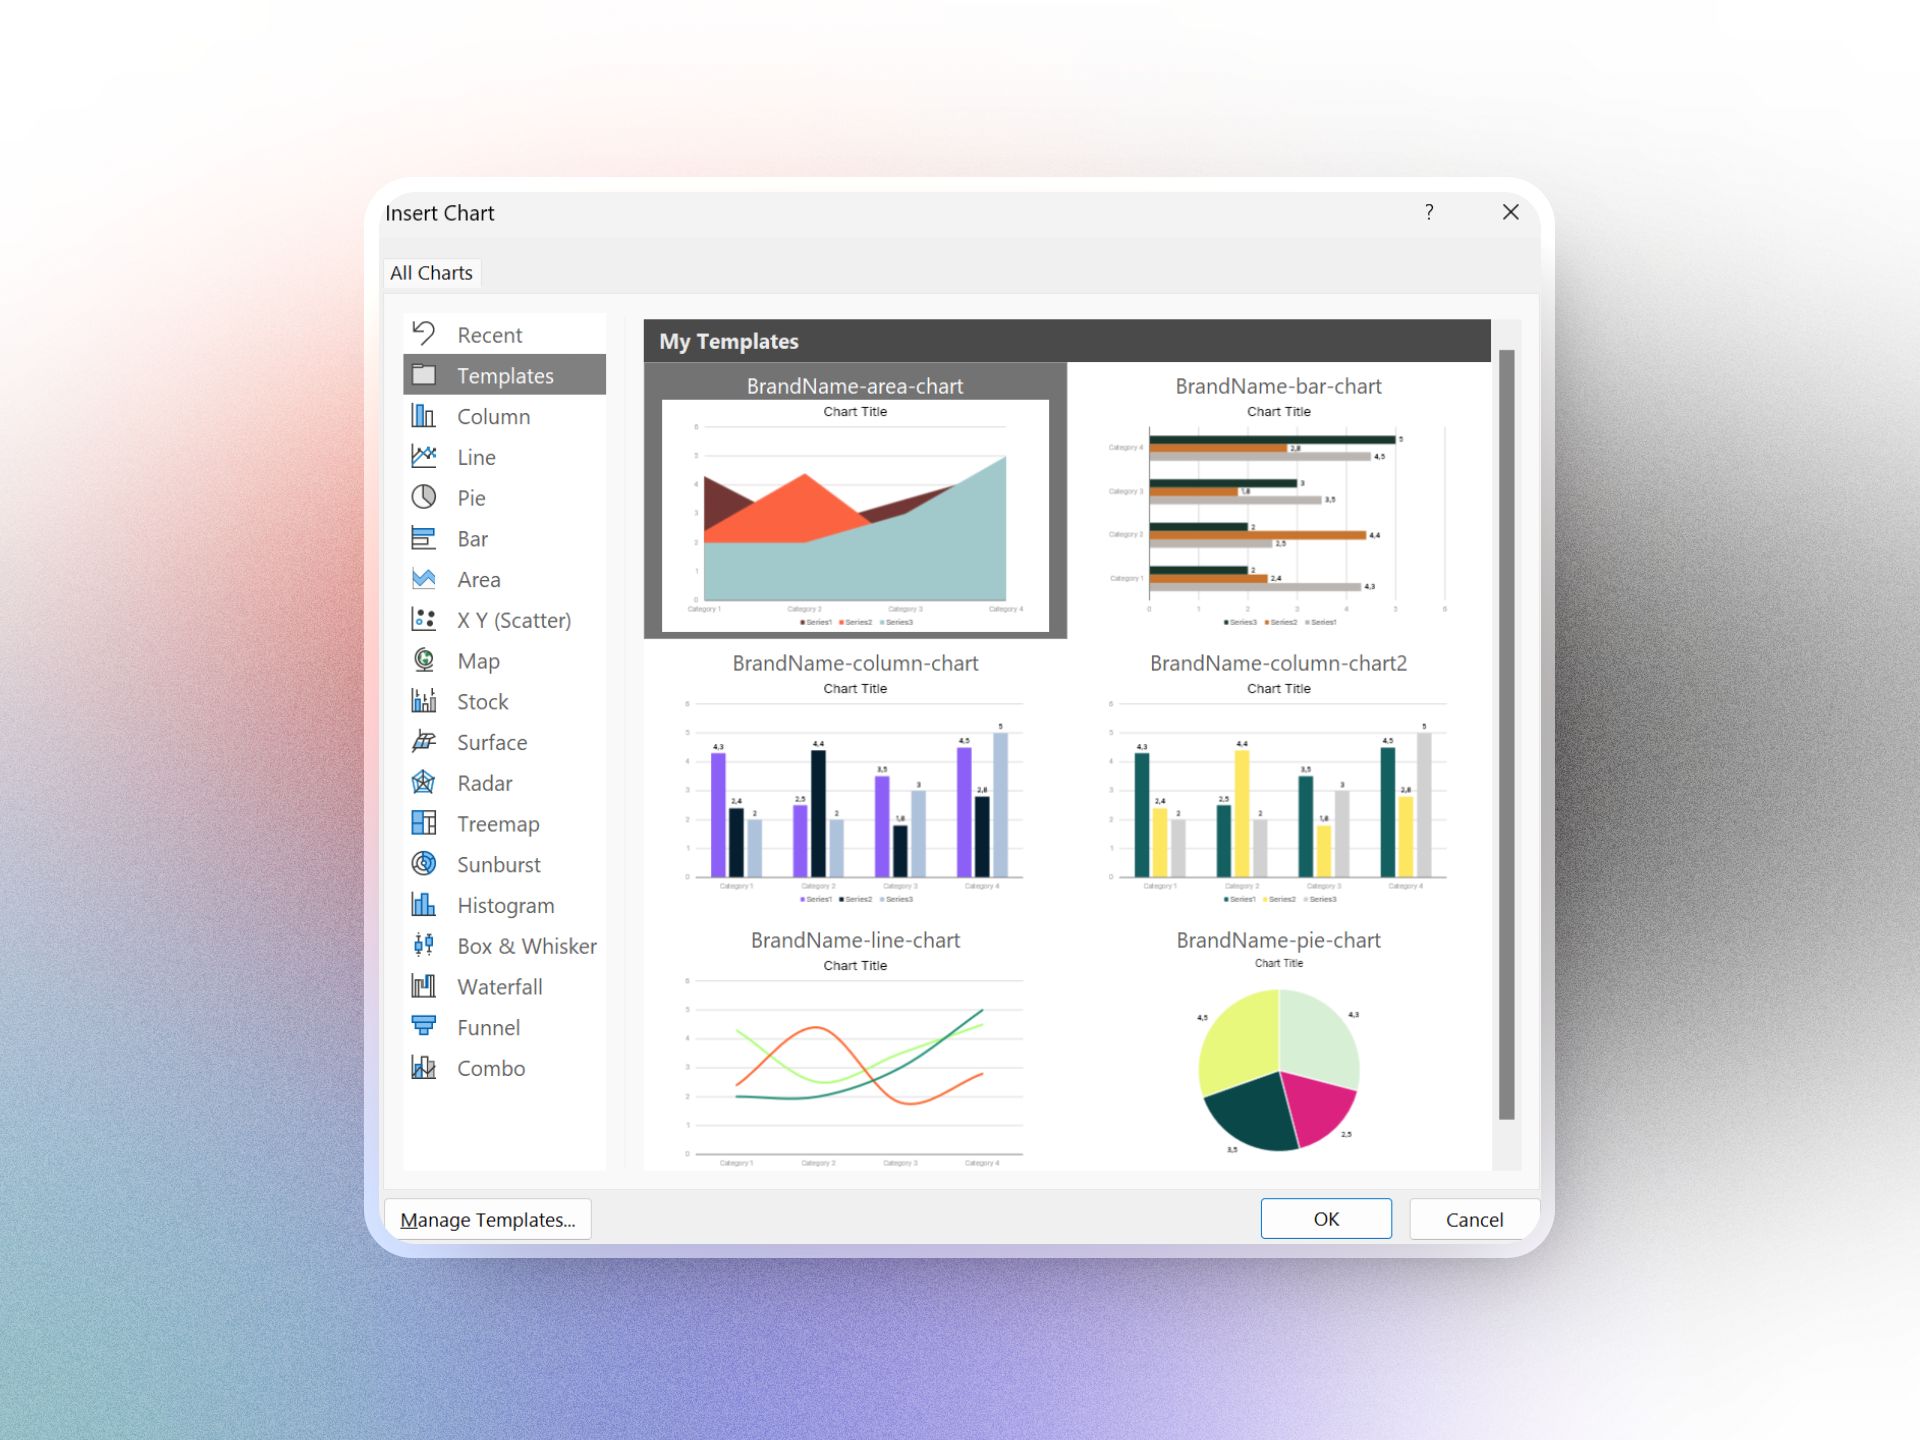
- Go to Insert > Chart and find your saved chart(s) under the Templates section.
Et voilà! You can now insert your custom charts and update the data, while staying on brand.
Tips for creating effective custom chart templates
- Keep it simple: avoid overloading your charts with too much data or design elements.
- Prioritize clarity: ensure labels, titles and legends are easy to read.
- Test for usability: share your template with team members to make sure it is user-friendly.
Bonus tips
Custom chart templates are saved locally on your computer. If you want to distribute them to your team, send them the template files (.crtx format) and they can add them to their templates folder C:\Users\YOUR_COMPUTER_NAME\AppData\Roaming\Microsoft\Templates\Charts.
For help with corporate PowerPoint templates and charts, PeknéPrezky is happy to assist.
'%3e%3cg%3e%3cg%20clip-path='url(%23clip0)'%3e%3cg%20clip-path='url(%23clip1)'%3e%3cg%20clip-path='url(%23clip2)'%3e%3cpath%20d='M42.2903%206.48009%2037.5197%201.70949C36.9562%201.146%2036.0425%201.146%2035.479%201.70949L30.7084%206.48009C30.2956%206.89285%2030.2956%207.56209%2030.7084%207.97488%2031.1211%208.38769%2031.7903%208.38769%2032.2031%207.97492L35.4604%204.73558C35.3251%2018.2709%2028.8666%2022.8405%2024.9997%2024.3607%2024.7212%2024.4702%2024.4394%2024.5702%2024.1543%2024.6608%2024.4533%2023.5617%2024.6761%2022.4433%2024.8209%2021.3136%2025.2952%2017.5644%2024.7544%2014.4593%2023.297%2012.5703%2021.0817%209.69872%2018.1357%208.40341%2015.0033%208.92243%2013.4035%209.19858%2011.9099%209.90805%2010.6851%2010.9737%209.44744%2012.0265%208.51416%2013.3913%207.98207%2014.9266%206.95868%2017.928%207.73529%2021.1154%2010.1133%2023.6717%2012.3931%2026.1228%2016.0101%2027.4462%2019.8085%2027.4461%2020.1948%2027.4461%2020.5826%2027.4323%2020.9716%2027.4045%2020.447%2028.6318%2019.8231%2029.8142%2019.1062%2030.94%2016.6406%2034.8015%2011.0472%2040.9488%201.28823%2038.7374%200.718472%2038.6156%200.157894%2038.9788%200.0361458%2039.5486-0.0835124%2040.1086%200.265397%2040.6617%200.822294%2040.795%202.2854%2041.1332%203.78171%2041.307%205.28339%2041.313%207.92696%2041.3246%2010.5362%2040.7137%2012.8998%2039.5297%2015.9982%2037.9815%2018.7592%2035.404%2020.8844%2032.0759%2021.8907%2030.4935%2022.7285%2028.8101%2023.3841%2027.0532%2024.1978%2026.8725%2024.9962%2026.6288%2025.772%2026.3242%2029.1932%2024.979%2032.0632%2022.4904%2034.0714%2019.1272%2036.3368%2015.3337%2037.513%2010.4981%2037.5709%204.74972L40.7959%207.97475C41.2087%208.38752%2041.8779%208.38752%2042.2907%207.97471%2042.7034%207.56192%2042.7034%206.89269%2042.2906%206.47993ZM22.7279%2021.0489C22.5458%2022.4549%2022.2349%2023.8412%2021.7992%2025.1903%2017.8943%2025.7249%2013.8966%2024.6417%2011.6577%2022.2348%209.79897%2020.2366%209.20266%2017.8833%209.97861%2015.6075%2010.7816%2013.2529%2012.9394%2011.4029%2015.3479%2011.0038%2015.6673%2010.9506%2015.9904%2010.9237%2016.3141%2010.9235%2018.2891%2010.9235%2020.1473%2011.9417%2021.6263%2013.8589%2022.7245%2015.2823%2023.1259%2017.9029%2022.7279%2021.0488Z'%20fill='%23BFBFBF'%20fill-rule='nonzero'%20fill-opacity='1'%20transform='matrix(0.771742%200.635935%200.635935%20-0.771742%20356.612%204176.52)'/%3e%3c/g%3e%3c/g%3e%3c/g%3e%3c/g%3e%3c/g%3e%3c/svg%3e)